In our earlier article, I discussed the Other Comprehensive Income (OCI) values for the S&P 100 companies. We had also seen the component-wise break-up of the OCI for these companies. Interestingly, the OCI values were large enough to significantly affect the net profits for their respective firms if they were ever realized.
Today, I’ll dig deeper and discuss one of the OCI components in detail – Pension Benefits. And as always, we’ll look at the S&P 100 companies for our analysis.
Types of Pension Plans
Pension plans can be of two types – Defined Contribution or Defined Benefit.
The Defined Contribution plan is comparatively easier on the employers pockets since the employer only must match the contributions of its employees. The company is not responsible for the asset allocation or the returns that are generated on the contributions. These are decided by the employees themselves. Defined Contribution plans are the norm as far as corporates today are concerned.
However, in a Defined Benefit plan, the employer commits to paying out a specified amount every month post-retirement to its employees. The payout is dependent on the employees last drawn salary and the length of service. Here, the employer takes on the risk of allocating adequate funds for future retirement liabilities as well as generating adequate returns on the investments.
In the past decades, almost all companies had launched Defined Benefit plans. But once they realized the economic ramifications, most firms restricted these plans only to the older employees while bringing the newer employees onto the Defined Contribution plan. Although the Defined Benefit plans now cover only a small percentage of their employees, the financial outlays continue to be quite substantial for many firms.
We closely studied the S&P 100 companies looking specifically for their funded status which is a function of the Projected Benefit Obligations (PBO), an estimate of the firms pension liabilities, and the Fair Value of Plan Assets, which is what the firm earmarks for meeting liabilities. The differential between the two indicates if the funded status of the Defined Benefit plan is positive or negative.
Simply put, Funded Status = Fair Value of Plan Assets Projected Benefit Obligations (PBO)
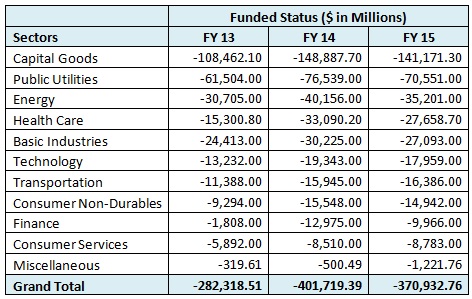
The study done through the IRIS Data Consumption Platform shows that a whopping 75% of the S&P 100 companies have a negative funded status in FY 15. The aggregate unfunded status for the S&P 100 companies in FY 15 is a mammoth $ 371 bn
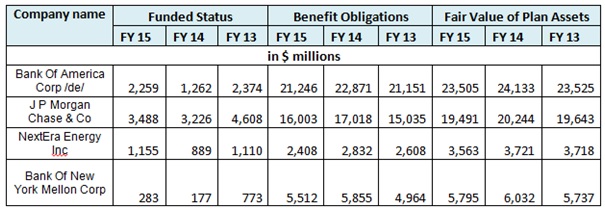
Out of the 5 companies with positive funded status in FY 2015, only 4 have been consistent for the past 3 years. Barring NextEra Energy, three of these are from the financial sector: Bank of America, JP Morgan, and Bank of New York Mellon.
(Sidenote: If you want a differently flavored story on banking credit provisions with specific observations on Bank of New York Mellon, you can read that here.)
And this is not a sectoral phenomenon. We categorized the companies by sector only to find that no sector (on an aggregate basis) had a positive funded status in any of the 3 years.
Companies to Watch with Unfunded Pension Liabilities
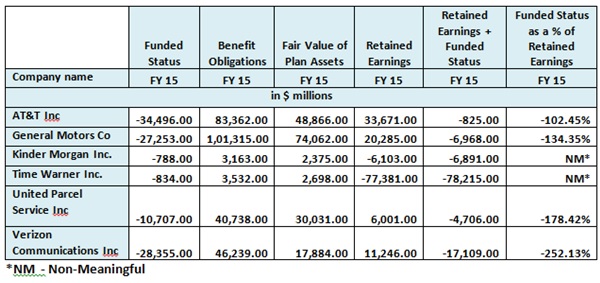
Getting back to our analysis, although 75 of the S&P 100 companies have a negative funded status in FY 15, we highlight 6 whose situation is a bit more precarious. For 4 companies, their retained earnings can no longer bridge the deficit in the funded status since the deficit is way bigger than their retained earnings. The other 2 companies, are running a fund deficit even while their retained earnings are hugely in the negative.
Companies with large unfunded liabilities are a cause for concern; not only for the employees in the uncertainty in benefits payout but also for the investors who may see value erosion in the long term. Unless these companies find a way in the interim to bridge this gap, these huge numbers are a potential ticking time bomb for stakeholders.


